
|

|
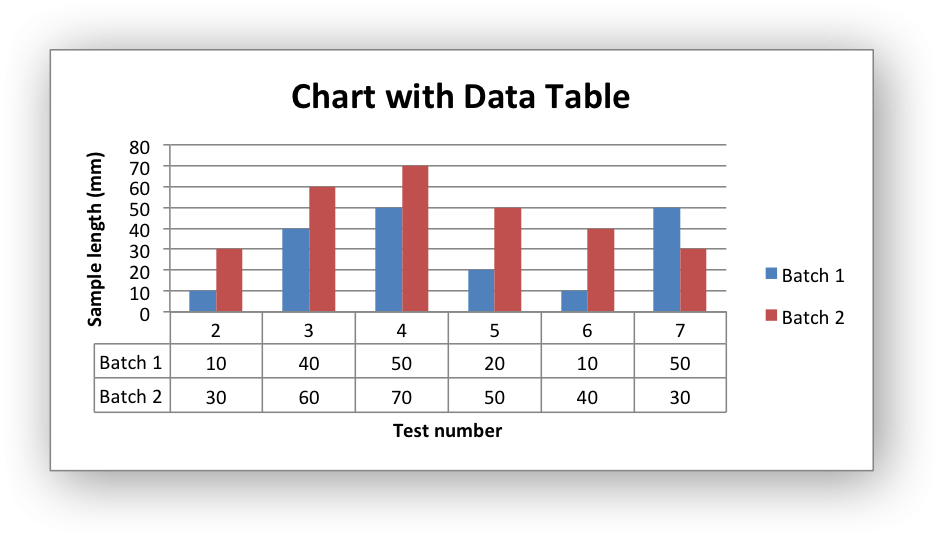
Data TablesTo construct a data table, you first need a title, independent and dependent variables, and measurable units. Organize all of the information into the table, making sure to label all of it. To get the best results and accuracy, try to get three or more trials for the experiment. Interpreting a table is relatively simple, follow the two sections and read the information found at the cross-section.
|

GraphsTo construct a graph (eg. line graph, bar graph, etc.), you will need data from the experiment. Then, just label the graph on the axes, and plot the data on the plane. If you are creating a bar graph, draw a bar and fill it in. If it’s a line graph, connect the dots. Don’t forget to include a main title and a title for each axis. Interpreting a graph is similar to interpreting a table, just follow the label to the point in the graph and follow the point to the unit.
|

ModelingModels are representations of experiments. You can get information about experiments by looking at their models. To make a model, first brainstorm an idea. Then, select the tools and materials you need. Make sure to choose items that are relevant to your experiment. Next, make the model by putting the materials together with the tools. Finally, present the model with the experiment.
|
